Structile

A spatial editor and diff tool for structured data.
Structile shows JSON (and Python-repr, CSV, XML, INI and TOML, and — with a small plug-in script — pretty much any text format) as nested, packed boxes instead of an indented tree: dicts become boxes-of-boxes, lists of similar-shaped dicts become tables, and everything is editable in place, searchable, undoable, and diffable.
Newer releases build on that: an interpreter can compute hover hints
for values — the bundled XML interpreter shows amounts in millions, or
converted to another currency
(live demo) — and expose its
own options in a panel; ≈ Flexible diff compares with tolerances —
numbers within 1bp, whitespace and case, dates within a day, ignored
paths — and counts what it accepted rather than hiding it; and a value
that links to another object previews it on hover, to pin, detach or
show in place.
This is the user guide: how to actually use it, in each of the three places it runs. It assumes nothing about your local setup beyond what each page says.
Three ways to run it
| What it is | Best for | |
|---|---|---|
| Standalone viewer | One HTML file, no install, no server. Open it in a browser and drop a file on it. | A one-off look at a file, or handing the viewer to someone with no Python/VS Code at all. |
| Python / Jupyter library | pip install structile — renders inline in a notebook, or writes/opens a standalone file from a script. |
Working with data already in Python (a dict, a loaded file, a diff() between two of them). |
| VS Code extension | Opens .json/.py/.csv/.xml files as an editor, synced live with the real text. |
Editing structured config/data files as part of normal editor workflow. |
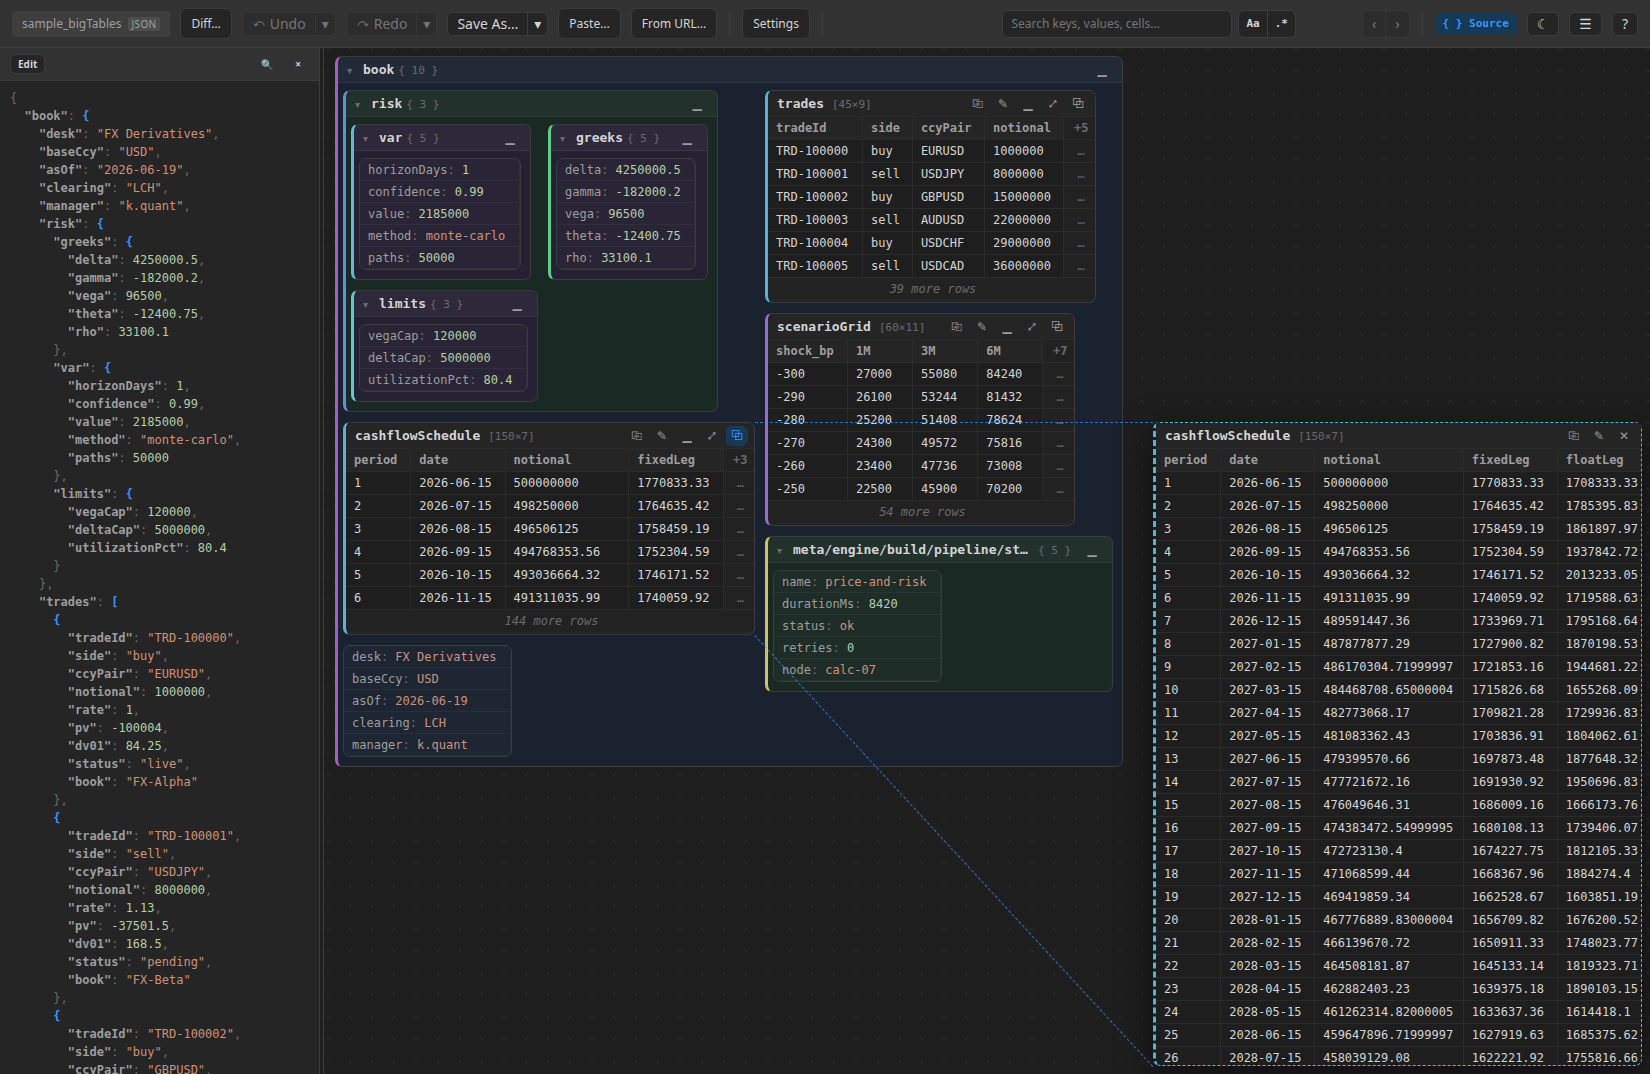
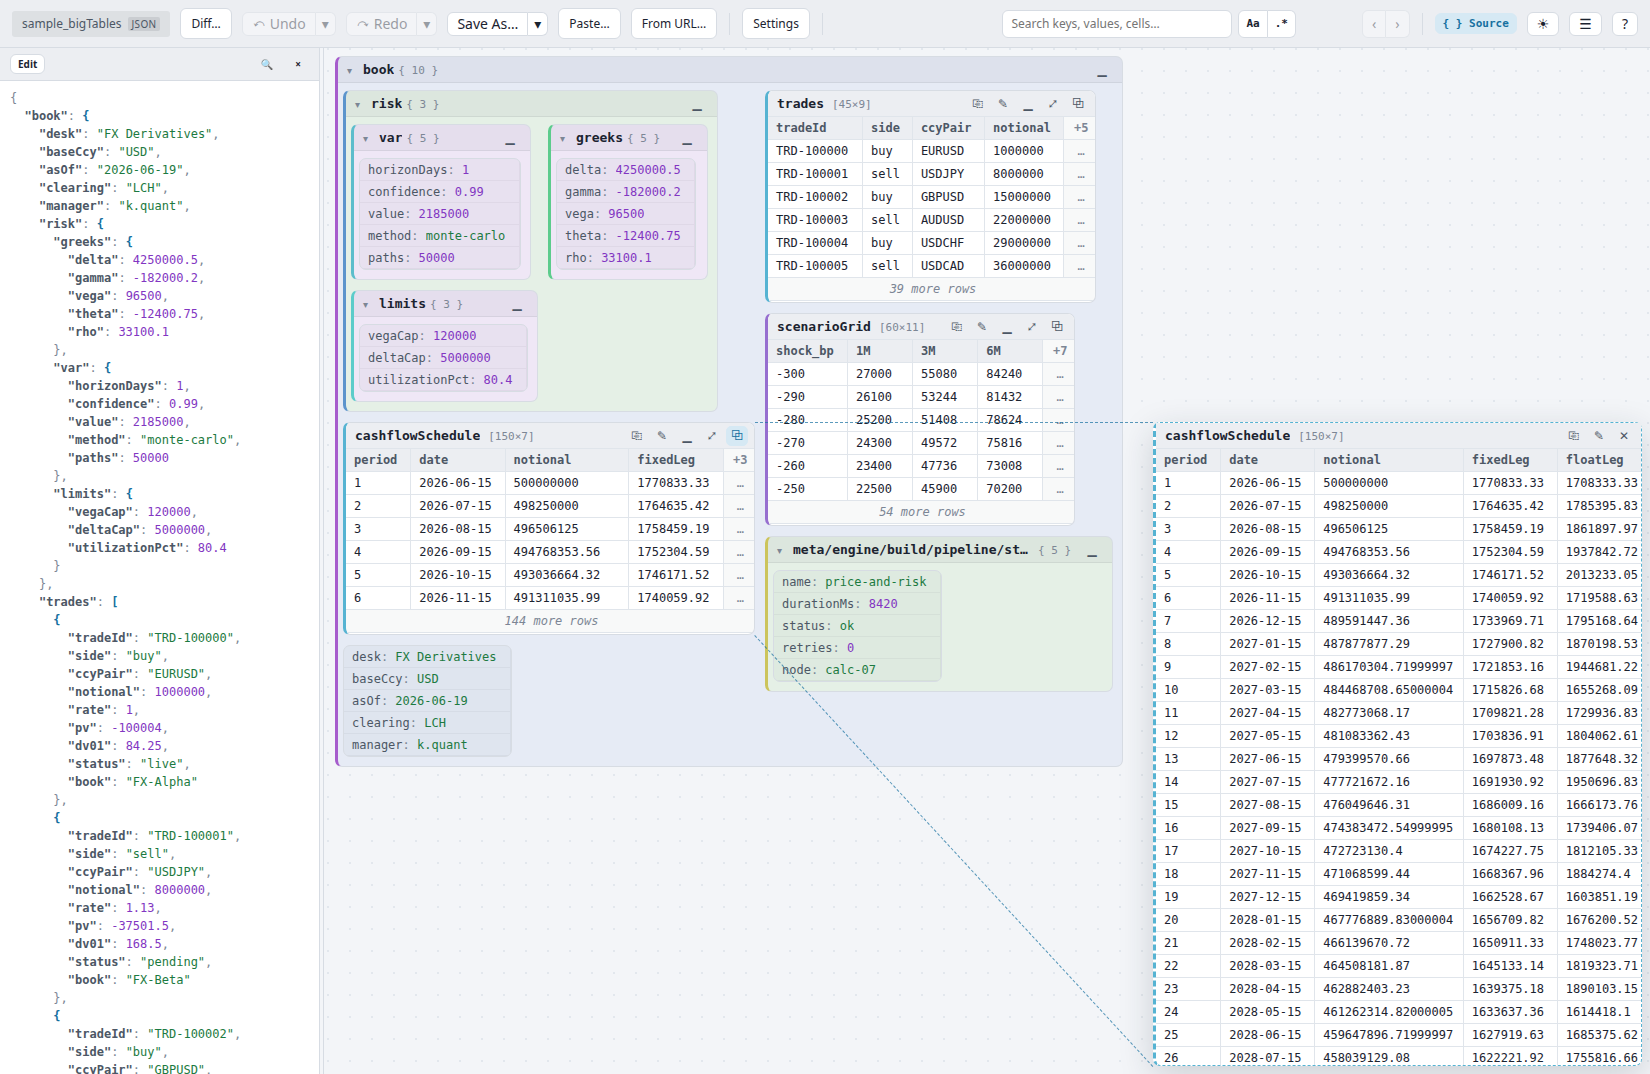 Click for live demo ↗
Hover for the other theme
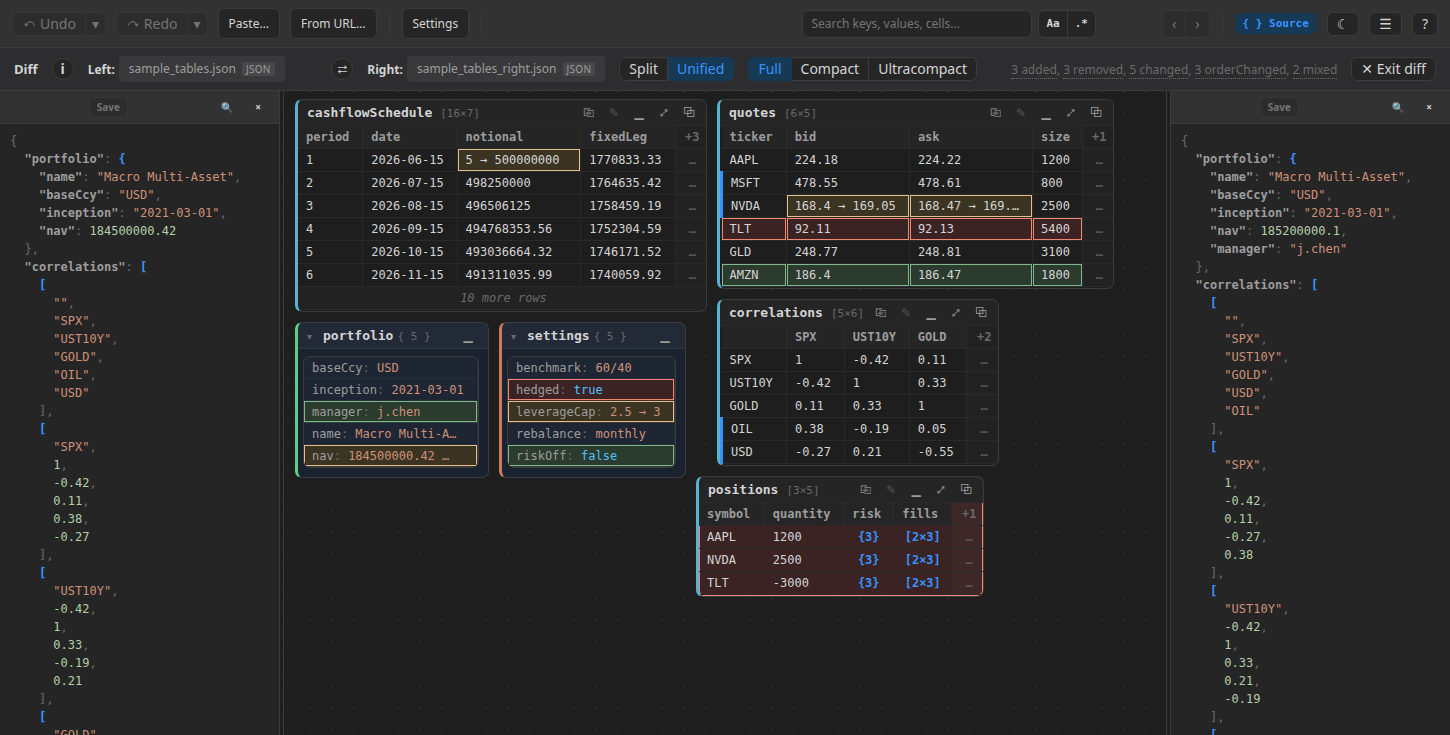
Diffing a portfolio against a recalculation of it, which differs everywhere a re-run does: amounts not rounded to the cent, a date written as a timestamp, a venue's case, the run's own metadata. The demo opens with ≈ Flexible diff rules that accept exactly that, so only the real changes are color-coded and the rest is counted apart, ≈ within tolerance, one click from being shown; each side's raw source is open alongside:
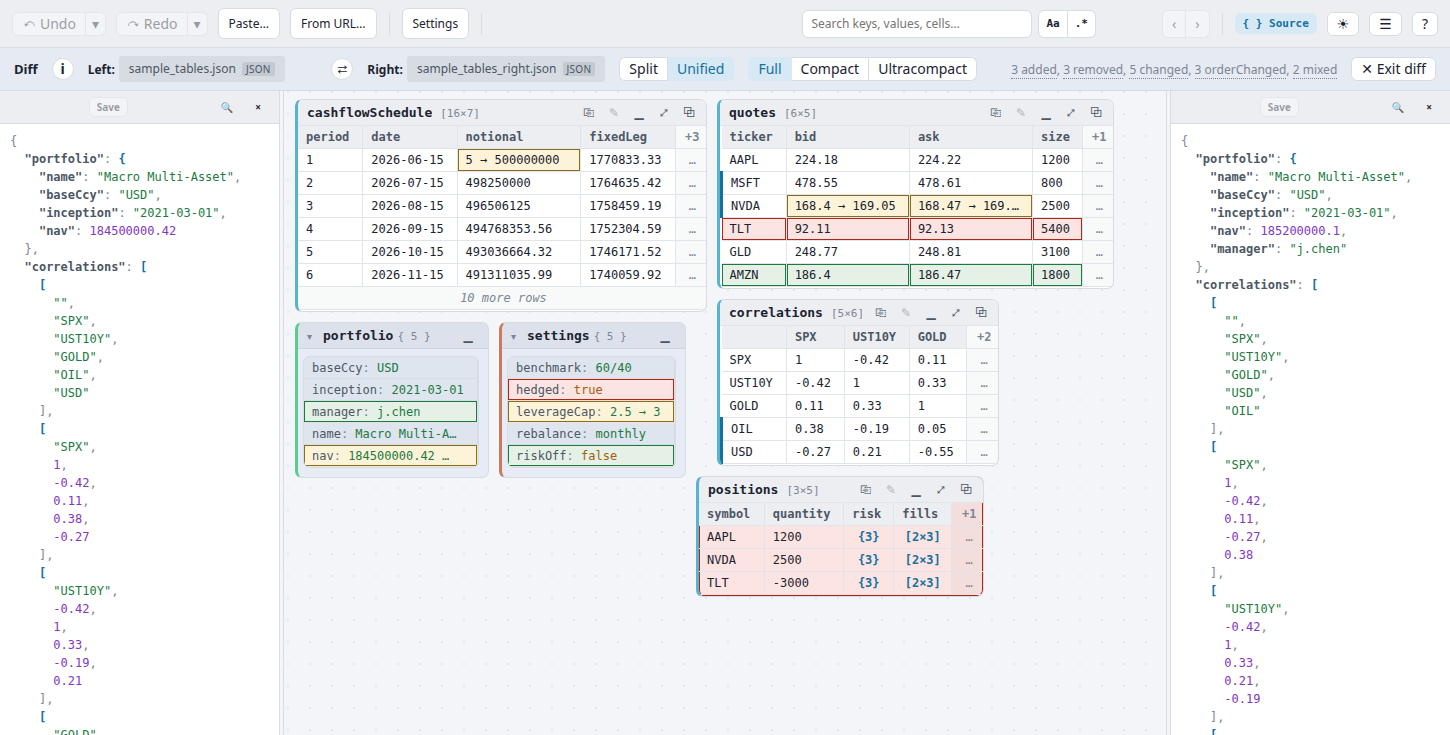 Click for live demo ↗
Hover for the other theme
All three are the same viewer underneath — a setting you learn in one transfers to the others, and a file saved from one opens correctly in either of the other two.
JSON, Python-repr and CSV (including tab-separated text) are read natively, everywhere — see CSV and tab-separated text, which also covers pasting a table straight out of Excel into any table. XML, INI and TOML come with ready-made interpreters, which the standalone viewer offers as soon as you open such a file. Structured data past that — writing your own format support, or handing that format support to other people — is covered once, for every environment, in Writing and distributing interpreters. Want to learn by running real notebooks instead of reading? See Examples & study material.
Install
- Python / Jupyter:
pip install structile— see pypi.org/project/structile. - VS Code extension: not yet on the Marketplace — download the
.vsixfrom the VS Code extension page and install it manually (two clicks, no account needed). - Standalone viewer: nothing to install — see the standalone viewer page for where to get the file.
Take it offline
Everything on this site is downloadable, not just browsable:
- This whole guide, as a zip — every page on this site, rendered to static HTML, readable with no internet connection.
- Runnable examples & sample data — see Examples & study material.
- The VS Code extension
.vsix— see the VS Code extension guide. - The standalone viewer HTML — see the standalone viewer guide.
- Samples and interpreters —
every bundled interpreter as its own
.jsfile, with the sample data it reads, or all of them as one zip.
What it isn't
Structile edits and compares structured data — it's not a general text
editor, a schema validator, or a database tool. If your file is source
code, use your normal editor; if it's .json/.py(-repr)/.csv/.xml/
.ini/.toml, or any other text format you're willing to describe with a small
interpreter script (see Writing and distributing interpreters),
that's exactly what this is for.